Technical Analysis Basics: Volume
August 10, 2009 | No Comments | Course
This article is part of the Trend Technician Technical Analysis Basics series. Be sure to read the rest of the series.
 Price and volume are the two essential pieces of information from which most technical analysis is derived. Volume reflects the activity of participants in a given issue. Each unit of volume reflects two people’s actions — One participant buys a share, contract or other issue and the other sells one. The total number of issues that changed hands is the volume.
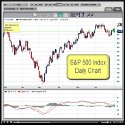
Typically on charts volume is represented as vertical bars at the bottom of the chart. The height of these bars represents the amount of volume for a given period of time. Typically this histogram appears on a chart below the price data. Volume can reflect many elements of the market psychology at a given time.
You can actually look at volume in several dimensions:
- The most obvious is the number of shares, contracts or other issues that traded handeds. This is the most common way to measure volume.
- Another way to look at volume is simply in the number of transactions that took place. The size is irrelevant, simply the number of times some number of shares traded hands. This number can give some insight into the number of participants in a market, but should obviously be taken with a grain of salt and is not widely used.
- Another way to measure volume is the number of price changes that occurred during a given period of time. This measurement can be referred to as tick volume. In this measurement, the number of shares or transactions are irrelevant until the price changes.
Volume is often seens as the primary measure of liquidity in a market. A market which makes many trades a day typically is viewed as more liquid than one which trades fewer. Volume is represented in several indicators, but is sometimes ignored by many traders. It can be an important element in confirming your beliefs on a trade and can be key in analyzing charts. Be sure to pay attention to volume during your trade lest you get false signals.
Photo Credit: Drab Makyo


