RSS |

Trend Technician

Just another WordPress weblog

Advertisement

Archive for the ‘ Featured ’ Category

Greece

If you’ve been paying attention to the crisis in Greece, you’re probably curious like I am what’s going to happen there. I’m not sure however that you need a strong opinion in order to make money on it.

The Crisis

Ultimately the crisis in Greece boils down to two things:

  • The Greeks spent too much and lied about it.
  • The other Euro states don’t want them to default, but don’t really want to bail them out.

Germany, the Euro country in the best position to bail them out wants to see serious improvements in their fiscal policy and serious cuts before they extend help.  In fact they’re hoping that just hinting around about giving aid will be enough to calm the bond market down.  It’s not clear however that their populace will put up with the idea of bailing out Greece so that Greeks can retire 10 years before them.  This of course highlights some of the conundrums the EU faces.

The Likely Outcome

Most people think some kind of bail-out will be worked out.  Greece will agree to spending cuts and other criteria and the most fiscally fit EU countries will help them out.  Order will be restored and faith in the EU will be revived.  In fact this is almost assured, because if they don’t bail out Greece, Portugal will probably default right behind them and several countries after that.  The EU can’t afford that kind of crisis so they will help, even though they won’t like it.

If you’re confident in this outcome, you could simply buy calls on the FXE.  Once order is restored in the European Union, the currency rebound and you’ll rake in the easy money.  Of course that’s assuming a lot of things.

The Black Swan

In his book The Black Swan, the author argues (I’m poorly summarizing here), that people by their nature underestimate the likelihood of the improbable.  Because of this you should always bet on the improbable because you’re getting better value for your money.  This is of course a painful strategy to accept, since most of your bets will be losers.  Of course your winners will be magnificent.

In the case of Greece, there is an interesting opportunity to just assume something interesting is going to happen.  Simply buy slightly out of the money calls and slightly out of the money puts.  If order is restored and the FXE rises, the gains should offset your losses on the puts.  If something unforeseen happens, then you will make a fortune on your puts, more than offsetting your losses in the long position.  The only situation in which you lose heavily is if the EU manages to punt the issue down the line and keep the FXE where it is.  So if you think this is a possibility then you probably wouldn’t want to make this trade.

Photo Credit: alaskapine
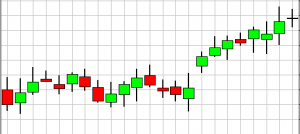
You probably aren’t as familiar with candlestick charts as you should be.  For years I used solely bar charts and trained my mind to read that particular type of chart and I can tell you this:  If you’re not using candlesticks you’re probably leaving money on the table.

Am I saying that candlesticks are better than bar charts?  We’ll get to that as well as a great resource to help you make money using candlesticks, but first let me tell you why you should familiarize yourself with candlestick charts.

As you read more and more charts your brain starts to make subconscious snap interpretations.  You learn a particular type of chart the way you might learn a language.  Before you buy or sell you’ll sit down and do rigorous analysis, but having familiarity helps you parse information quickly.  Learning to read candlesticks gives you another dimension from which to analyze a chart and there’s no reason not to know how to use them.

The Difference of Candlestick Charts

So given that they represent the same data, why do you need candlesticks?  Well if you look at a typical bar chart, a lot of the data is deduced.  You have the same information on a bar chart that you do on a candlestick chart, but some information is not immediately obvious.  Did the stock close higher or lower than it opened?  I can tell this at a glance with a candlestick chart, while I need to read the little nubs on a bar chart to know this.

As I mentioned, the same information is there, but on a candlestick chart some of it has already been processed for me.  Thus my powers of induction are freed to look a little deeper.  From years of experience, my mind can intuit from a bar chart whether a stock went up or down, but that information was obvious to anyone at first glance on a candlestick chart.

The distinct shading of the open and close regions also yields other benefits for helping your mind read a chart quickly.  The candlestick has a tendency to make your mind more aware of the area between the open and close by representing it so visually.  It highlights that difference, where a bar chart does not.  Thus the candlestick chart helps my mind prioritize things that a bar chart doesn’t.

So, are Candlesticks Better?

Candlestick and Bar charts focus on different things and provide different benefits.  Neither is “better,” but this answer to me is clear:  Being able to read both is better than being comfortable with only one.  Why limit your analysis to only one area of emphasis.  Why not be able to get the benefits of both methods?

Learning More about Candlesticks

So now you want to learn more about candlestick charts?  INO’s Trend TV currently has a free video about candlestick charts for its users.  It’s free to sign up, and you’ll have access to the video before you need to decide if you’re interested in the product they offer. They’re also offering three other free videos at this time.

TrendTV's Free Video on Candlestick Charts

TrendTV's Free Video on Candlestick Charts

In this complimentary video, “Advanced Applications of Candlestick Charting,” authors, software programmers, and co-founders of the International Pacific Trading Company, Gary Wagner & Brad Matheny will walk you through:

  • History of candlestick charting
  • How to interpret candlesticks
  • How to merge techniques of Eastern & Western technical analysis together
  • How to merge candlestick techniques with your current trading plan
  • And more…

This 100 minute complimentary video can be found on Trend TV. You don’t have to worry about watching the whole video at once. After you have a password, you can revisit anytime to watch the rest of a video, review a video, or watch other videos on Trend TV.

Go sign up and put another tool in your toolbox.  How can you regret getting more money making weapons for free?  Speaking of which if you haven’t already, be sure to read our technical analysis basics series for more free information.

No one factor is likely to drive broad trading decisions than inflation. As with so many other factors right now, there are fundamental indicators swinging in both directions when trying to make a call on inflation. The conventional wisdom has been that a recovery will mean inflation due to a policy of quantitative easing, and that if the green shoots aren’t really green, that we’ll have deflation. There are problems with both of these suggestions however.

The Problem with the Deflation Hypothesis

If you look at the CPI numbers you will be impressed with the year over year (yoy) deflation.  The recession has been biting us hard and we’ve been tightening our belts driving prices down.  That all sounds good except the data don’t seem to support that at all.  If you look at the 12 month CPI numbers for June 2009, you’ll see that other

Considering Gold?

Gold can be a great way to preserve your value in times of inflation, but it’s all about timing. Get this FREE analysis of gold before you move.

than Transportation and Energy there has been no other sector that has experienced deflation.  Let’s be clear about what that means.  Despite all the panic going on, overall prices haven’t come in at all except for the collapse of oil prices and the disinterest in cars.  This would seem to suggest that once the economy gets moving again we’re going to have rampant inflation once all the money the government has printed gets moving.

The Problem with the Inflation Hypothesis

But of course things can’t be that simple.  On the flip side of all this is an important fact:  A tremendous amount of wealth was destroyed in the financial crisis.  While the numbers vary, there are suggestions that somewhere around 40% of the world’s wealth was destroyed by the financial crisis.   Imagine the impact of that destruction of wealth on the buying power of the world.  If people are not exercising the same purchasing power they did before, then all that money that the government is printing may never gain enough velocity to cause any real inflation.  Unless governments printed a lot of money, they’re going to have a hard time counteracting all that destruction of wealth.

Another Case for Technical Analysis

This leads me to the same old drum I’ve been beating all along.  In cases like this you have to resort to the technicals (e.g. this free video from INO.com, simply join their mailing list and you’ll get a fantastic resource for free).  Buy (or sell) and hold can be disasterous when applied at times of chaos like this.  You can be right in the long term and still go broke in the short term.  Thus I strongly suggest arming yourself with the tools to make decisions based on market psychology as well as other factors.  In addition, in times like this you can hedge your bets with what I call the the “Triple Call Technique.

Photo Credit: Erik Charlton

Natural gas is a tricky trade.  While market psychology plays a huge role even in commodity trades, the price is in the throes of some serious fundamental impacts.  The price skyrocketed to reach spectacular highs in 2008 and has plummeted since.  Even as it has declined, it’s been a popular buy by some as evidenced by the fact that the UNG ETF has run out of shares until regulators approve more. [More]

MACD Analysis

June 30, 2009 | No Comments | Featured

tracks

The first indicator we will cover in depth is the MACD, or Moving Average Convergance/Divergence. This is predicated on the knowledge of a moving average, which we’ll actually discuss later, but is a pretty simple concept. A moving average is simply the average of the previous number of days. So a 5 day moving average is the average of the previous 5 days closing prices. The EMA, or exponential moving average is a decaying average of some number of days where the more recent days are weighted more heavily.

[More]

Psychology

Mastering psychology is easily as important as any other type of analysis involved in trading markets. There are two psychologies you need to be worried about, the markets and your own. Your own is much easier to read but can still be very hard to control.

Discipline

Trading psychology is much easier to identify than to control. Many times when we’re trading we will decide that this particular case requires a different set of rules than the usual case. This is usually the first step towards a bad trade.

Ups and Downs

One of the first issues you will have to purge from your behavior is the mood swings that can come from trading. When you win you are a genius, when you lose you are a failure. Eventually, if you are going to be successful, you must learn to simply see wins and losses as inevitable parts of the process. Wins and losses have hundreds of different sources and your primary goal should always be to put the odds in your favor. You can make the right decision and still lose money or leave money on the table. You want to be a trader, not a gambler.

Getting Your Money Back

One of the most damning reactions to losing money is to try to “get it back.” Once again you must view losses as simply parts of the process. You will have losses. There’s no way around it. If you can be right even half the time, with good money management that can be enough to make a fortune. However if you let your losses destroy you in a desperate attempt to “win” every trade, you are doomed to turn minor losses into catastrophes.

Self Destruction

Another characteristic that plagues traders is the instinct to take a success and turn it into a loss. As people decide they are brilliant and have “beaten” the market, they start to take more risks and bend their rules. This is when they turn self-destructive and bring ruin on themselves. Just as you can’t let your losses destroy you, you can’t let your wins do so either.

The Rules

The key to successful trading is to develop your rules and then stick to them. You need to develop your own system and don’t let dreams of riches or fears of doom derail you. While it’s important to always be updating and tweaking your system, you mustn’t develop them in the middle of a trade. While your psychology can be difficult to master, once you have you need only start to try to identify the market’s psychology. Thus you’ve removed dangerous variables.

If you’re not using technical analysis, you’re probably leaving some money on the table. Historically there were essentially two divided armed camps of investors. There was the fundamental analysis camp and there was the technical analysis camp and the two were constantly at each others’ throats. With the fundamental camp brandishing their copies of Graham and Dodd while the technicians scoffed and waved their charts dismissively. Recently however that animosity has been declining. People are increasingly realizing something: [More]